A free SEO Chrome extension that checks the page you're on
What the SEOComet SEO Toolbar checks on each tab, how it compares raw and rendered HTML, the in-page SEO bar, and how to install it. Free, no account.

When I look at a page for SEO, I ask the same questions every time. Is it indexable? Does the canonical point where it should? Is the title too long? Did a script change any of that after the page loaded? Answering them usually means view-source, the developer tools and a couple of testing sites.
So I built the SEOComet SEO Toolbar, a Chrome extension that answers those questions for the page in the current tab. It’s free, it needs no account, and it’s now on the Chrome Web Store. This post walks through what it checks.
The popup, tab by tab
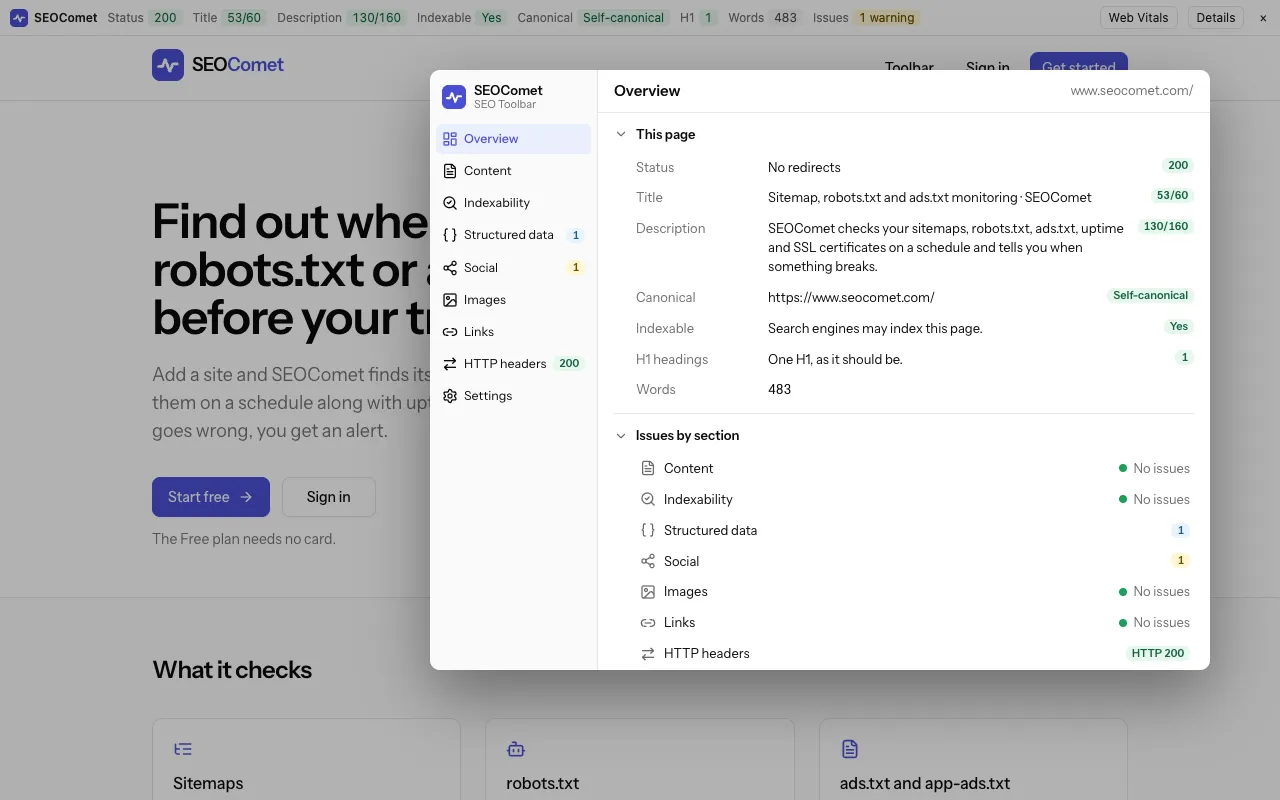
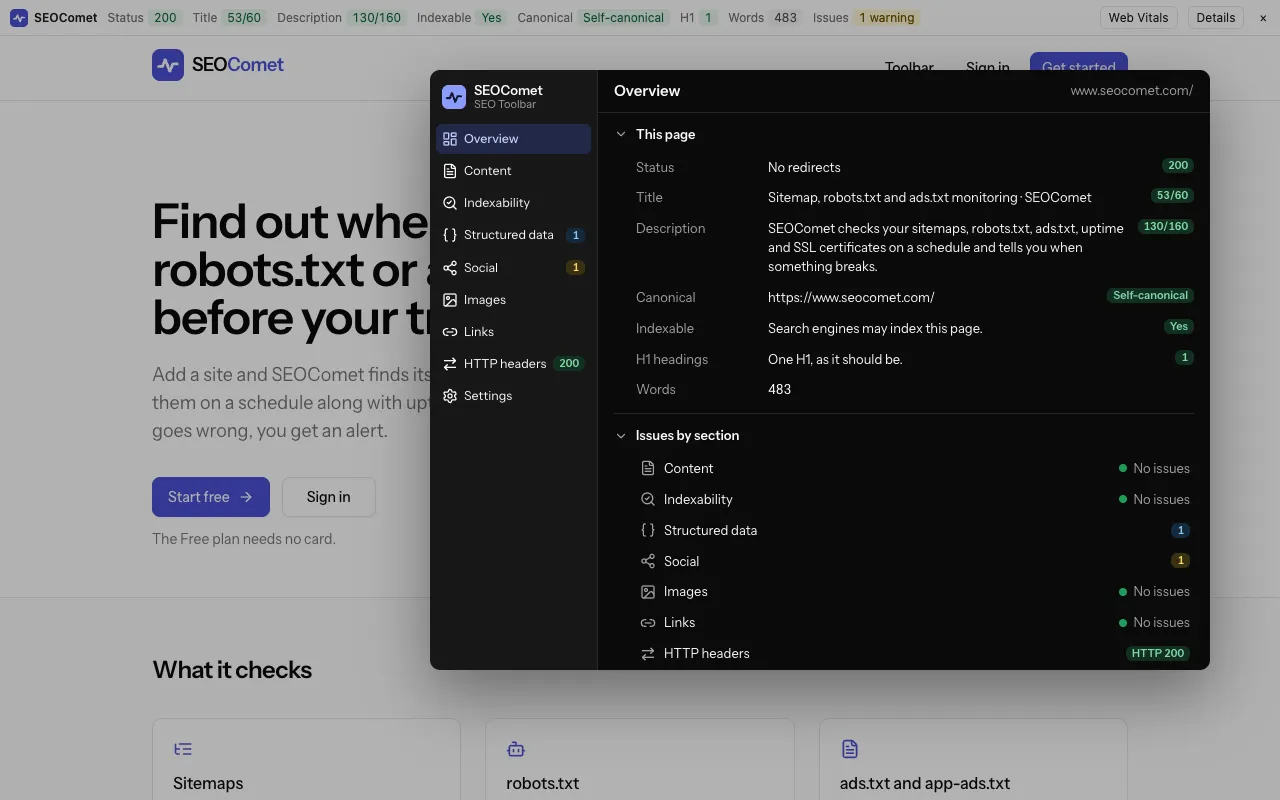
Click the toolbar icon and a popup opens on the Overview tab. It shows the status code and any redirects, the title and description lengths, the canonical and whether it points to the page itself, whether the page is indexable and why, the H1 count and the word count.
Each tab in the menu carries its own issue count, coloured by the most serious problem, and lists those problems at the top marked critical, warning or info.
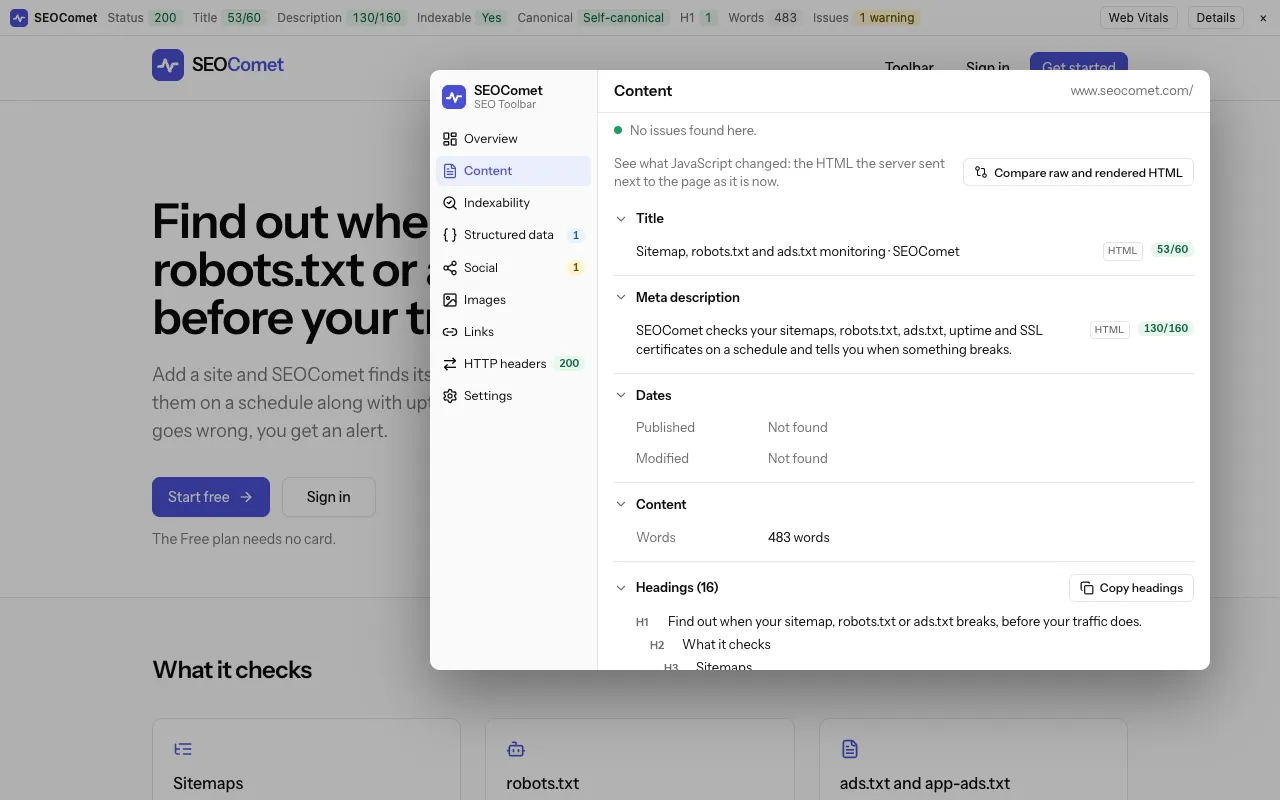
- Content lists every title and meta description on the page, both from the HTML the server sent and from the page after JavaScript ran. It checks their length against 60 and 160 characters, flags any that sit outside the
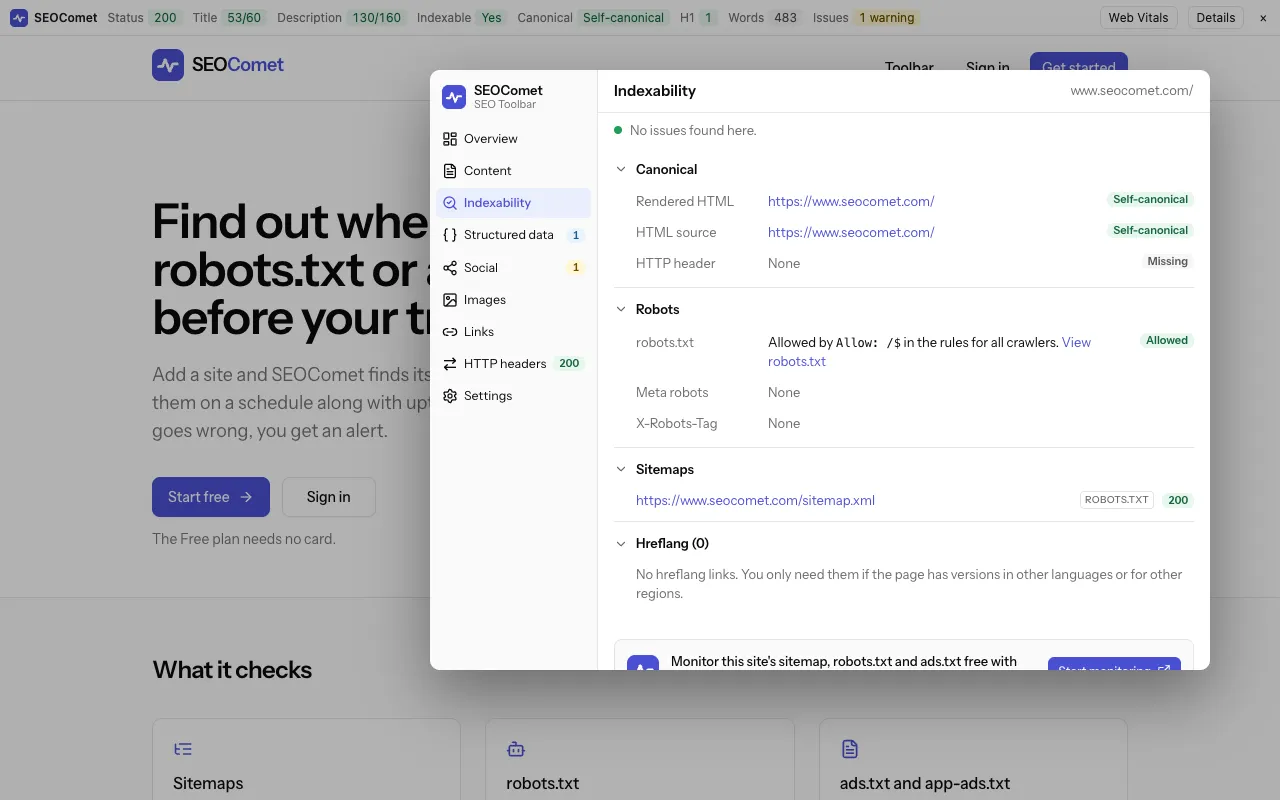
<head>, and shows published and modified dates, the word count and the heading outline from H1 to H6, which you can copy. - Indexability covers meta robots, the X-Robots-Tag header, and whether robots.txt allows the page, quoting the rule that matched. It lists the sitemaps named in robots.txt, the canonical from the HTML, the rendered page and the Link header, and any hreflang links.
- Structured data shows JSON-LD and microdata as a tree you can fold, with the required and recommended fields each type is missing. A Validate menu opens the page in Google’s Rich Results Test or the Schema.org validator.
- Social lists the Open Graph and X (Twitter) tags, builds a share preview and checks the share image’s size.
- Images lists every image with its alt text and dimensions, fetches file sizes when you press the button, and exports to CSV.
- Links lists every internal and external link with its nofollow, sponsored or ugc value. When you ask, it checks each one for redirects, broken links and timeouts. You can filter, search, highlight them on the page and export a CSV.
- HTTP headers shows the redirect chain hop by hop, including JavaScript redirects and meta refresh, with the full response headers for each step.
As you browse, the icon shows each page’s issue count: red when something is critical, yellow for warnings, a green tick when the page is clean.
Raw HTML next to the rendered page
A lot of sites change their head tags with JavaScript: a framework adds a canonical, a tag manager rewrites the title, a script injects JSON-LD. A crawler that doesn’t run the script only sees the first version.
On the Content tab, “Compare raw and rendered HTML” opens a new tab with the two side by side. A summary table at the top shows where the title, description, canonical, robots, H1, JSON-LD blocks and link count differ. Below it is a line-by-line diff of the HTML or of the visible text, with a switch to show only the lines that changed. This is the kind of difference it catches:
<!-- In the HTML the server sent -->
<link rel="canonical" href="https://example.com/shoes">

<!-- In the page after JavaScript ran -->
<link rel="canonical" href="https://example.com/shoes?colour=red">
The SEO bar
If you’d rather not open the popup on every page, press Alt+A (Ctrl+⌘+A on a Mac) to turn on the SEO bar. It’s a strip across the page with the status code, title and description length, indexable, canonical, H1 count, word count and issue count, plus Web Vitals and Details buttons.
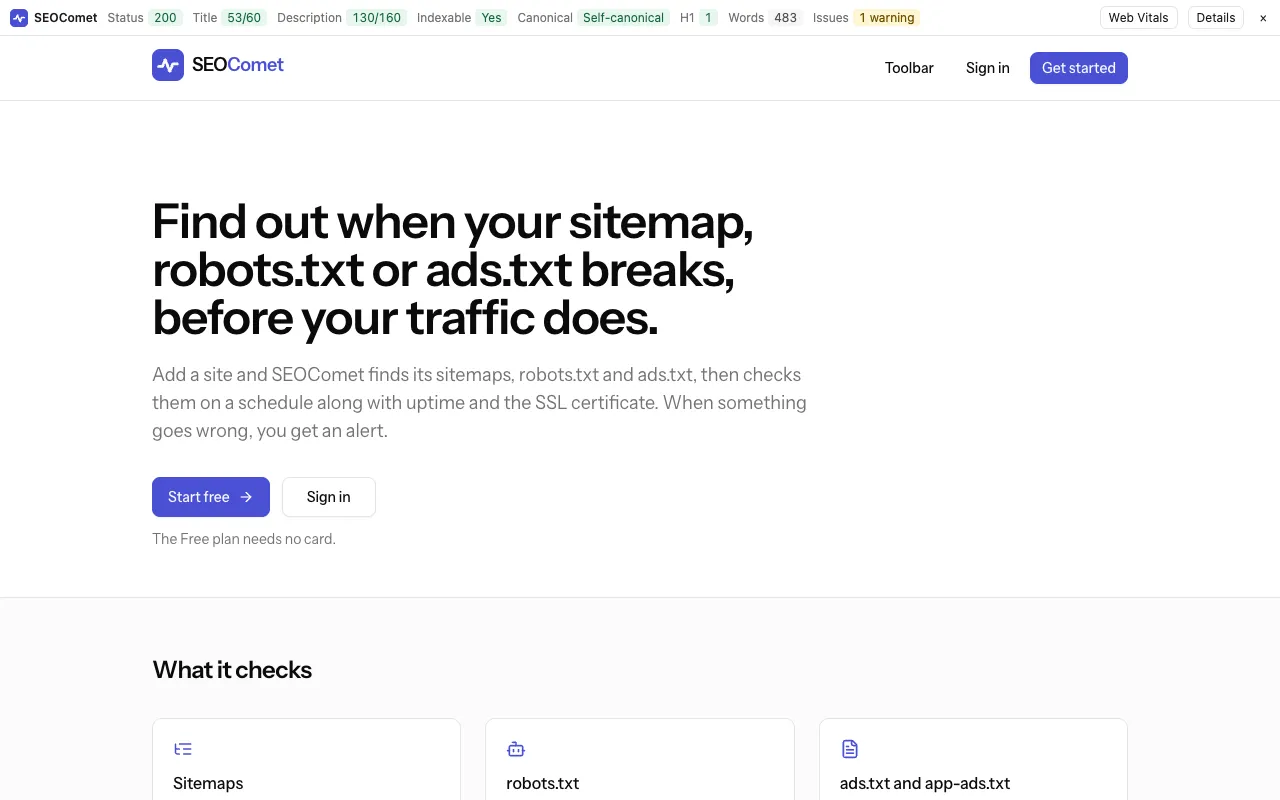
It’s off until you turn it on, you can hide it on one page or a whole domain, and it never appears on web apps like Gmail, Docs, YouTube or Google search.
Core Web Vitals on demand
The Web Vitals button fetches LCP, CLS and INP from the Chrome UX Report, which is data from real Chrome users rather than a lab test. If the page has too little traffic for its own figures, you get the whole site’s. Nothing is fetched until you press the button, and you can add your own CrUX API key in Settings.
What it sends, and what it doesn’t
Nothing goes to SEOComet. The toolbar reads the page in your tab, fetches that site’s robots.txt and sitemap, calls the Chrome UX Report API when you ask for Web Vitals, and requests the page’s images and links only when you press a check button. The toolbar section of the privacy policy lists every request.
Settings has a light, dark or system theme, the tab the popup opens on, the SEO bar options and an exclude list for sites where you don’t want the badge or the bar.
Install it and tell me what’s missing
Open the SEOComet SEO Toolbar on the Chrome Web Store, click Add to Chrome, and pin the icon from Chrome’s extensions menu so the issue count stays visible.
If a check gets something wrong, or you’d like one it doesn’t have, email me at [email protected] with the page URL and what you expected to see. The support page answers the common questions.